Naumovski F1, Durnev V1, Kartalov A1, Kuzmanovska B1, Toleska M1, Trposka A1
1PHI University Clinical Center “Mother Theresa” – Skopje,
Department of Anesthesiology, Resuscitation and Intensive Care
UDK: 616.24-073.432.19:616.24-002-085.816.2
https://www.doi.org/10.55302/MJA2481039n
Abstract
Lung Ultrasound (LUS) is widely used in diagnosis and monitoring of Ventilator Associated Pneumonia (VAP). The aim of our study is to evaluate and detect local lung events in mechanically ventilated patients, as well as to evaluate the usage of LUS in distinguishing VAP from Ventilator associated tracheobronchitis. We examined LUS finings in all patients who fulfilled the criteria for VAP, and stratified them according to the CLUE Protocol. We have examined the findings for VPLUS Score of each patient and tried to find a correlation between LUS Score and VPLUS Score. The average value of total LUSS of all patients examined was 11.05. LUS Score of the upper segments versus lower segments was 0.07 versus 2.1 respectively with 95% CI from 1.44 to 2.61, and significance level p<0.0001 suggesting the existence of statistically significant difference into distribution of pathological findings in between upper versus lower lung segments. Also, we found a LUS Scores difference of 3.46 with 95%CI of 0.95 to 5.96 and significance level of p=0.0099 which implies existence of statistically significant higher LUS Score values in patients with VPLUS >2 versus patients with VPLUS of 2. In conclusion, the pathological findings in patients with VAP were distributed in the dependent regions, while upper segments were spared. Also, only patients with VPLUS>2 instead of VPLUS≥2 should be considered as having VAP.
Key Words: Lung Ultrasound, Ventilator Associated Pneumonia, Ventilator Associated Tracheobronchitis.
Introduction
Lung ultrasound (LUS) is an attractive and repeatable point-of-care diagnostic tool that can provide significant data about the local lung parenchyma happenings in mechanically ventilated patients. As a feasible method with no irradiation power, nowadays it is widely used in diagnosis and monitoring of Ventilator Associated Pneumonia (VAP) (1,2).
Aim of Study
The aim of our observational study is to evaluate and detect local lung happenings in mechanically ventilated patients with positive microbiologic findings and abnormal laboratory values of the infective markers implicating possible presence of VAP, as well as to evaluate the usage of LUS in distinguishing VAP from Ventilator associated tracheobronchitis.
Material and Methods
We conducted a retrospective study in 18 patients hospitalized in the Intensive Care Unit at University Clinic for Neurosurgical Diseases in the period from 1st September 2019 to 1st of June 2020. In accordance with the Helsinki Declaration dated 1975 and revised in 2000, this study was conducted after obtaining an Ethical Approval given from the Institutional Ethical Committee under the number 5.1-2020/5.
The inclusion criteria for this study were: the patient must be ≥18 years old, must be mechanically ventilated more than 48 hours, must have abnormal laboratory findings for total White Blood Cells (WBC) count and/ or percentage of neutrophils and/ or elevated CRP. All patients must have positive microbiological findings of previously taken tracheobronchial aspirates and must have elevated body temperature. In other words, all patients that met the criteria for existing suspected VAP were included in our study. All patients that have fulfilled the inclusion criteria underwent LUS examination according to the BLUE protocol (1) obtained with Ultrasound Machine Mindray TP2200 while curvilinear probe was used. We’ve examined bilaterally upper and lower, anterior, lateral and posterior in total 12 segments, and scored every segment with 0, 1, 2 or 3 when normal findings (A-lines and lung sliding) were present (Figure 1), when 3 well separated B-lines were present (Figure 2), more than 3 B-lines or coalescent B-lines were present and consolidations were noted, respectively. Total LUS Score (LUSS) was calculated for every patient and according to the CLUE protocol, the best result of LUSS could be 0 suggesting normal finding of well aerated lungs, and the worst seen result could be 36 including 12 zones of both lungs suggesting total lung de-aeration. According to the findings of the CLUE protocol, the degree of loss of aeration is graded as mild when the LUSS value is 1-5, moderate when LUSS value is ≥ 5 – 15 and severe when LUSS value is higher than 15. Average values of LUSS findings were calculated for every single segment examined, as well as for each lung separately and for total LUSS value. Comparison of two means as statistical method was used to calculate if there was any statistically significant difference of the findings in both lungs, as well as in upper versus lower lung segments. The findings of A/B patterns, B-patterns, consolidations, air bronchograms and pleural effusions were noted and evaluated with descriptive statistical methods. Also, we calculated the Ventilator-associated pneumonia lung ultrasound score (VPLUS) for each patient where purulent tracheal secretions were graded as 1 if present, existence of positive microbiological cultures were graded as 1 if present, existence of subpleural consolidations were graded as 1 if present, and finding of areas with bronchograms were graded with 2 if present. According to the literature, if VPLUS is ≥2 VAP could be identified with 71% sensitivity and 69% specificity (2).
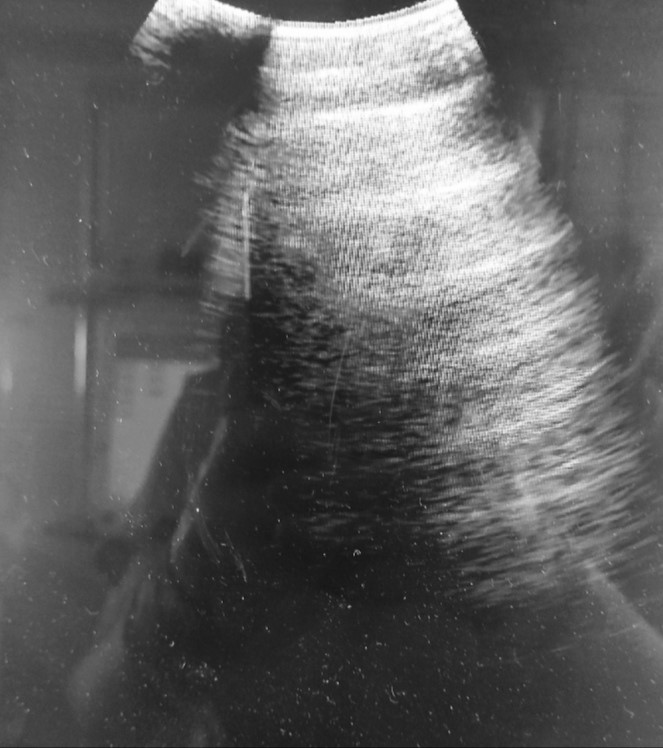
Figure 1. Normal ultrasonographic findings with presence of an A-lines suggest good lung aeration.
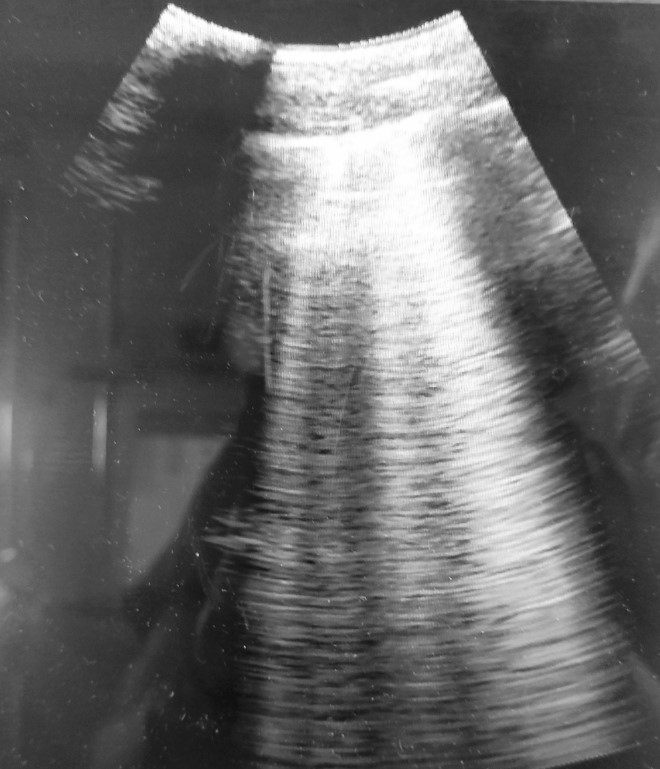
Figure 2. B-profile: well-shaped vertically positioned laser-like lines that show presence of an interstitial syndrome.
Results
We included 18 patients in our study which were in mean value 54.5 years old. Fifteen (83.3%) of the patients included were males. The average value for SpO2 of the patients included was 94%, average WBC count was 11.7 x10⁹/L, average percentage of neutrophils was 81.47%, the average value for CRP was 204.17mg/L, while mean body temperature was 38.3ºC. The average in hospital length of stay of all patients included in the study was 63.4 days.
All patients had a positive microbiological finding of the previously undertaken tracheobronchial aspirate. In half of the patients, which means 9 (50%), only one pathogen was isolated, and in the other half of the patients mixed, multiple pathogens were isolated. Gram positive bacteria were isolated only in 2 patients (11.1%), while gram negative pathogens were found in 18 (100%) of the patients included in the study. Fungi (Candida albicans) were isolated in only 2 (11.1%) out of 18 patients. Acinetobacter species was found in 14 (77.7%) of the patients, as well as Pseudomonas aeruginosa was isolated in 14 (77.7%) of the examined specimens. Only in 2 patients, presence of Staphylococcus aureus was found.
According to the results of the LUS examination, presence of A/B pattern (Figure 3) and B pattern (Figure 2) were found in all examined patients (100%), distributed through the lungs and seen at different sites of examination. Lung consolidations (Figure 4) were seen in 14/18 patients (77.7%), while in 11/18 patients (61.1%) presence of air bronchogram was verified. Pleural effusion (Figure 5) was identified only in 7/18 patients (38.8%).
The average value of total LUSS of all patients examined was 11.05. If we score the severity of de-aeration according to the CLUE Protocol, 3/18 patients (16.6%) experienced severe aeration loss, while in the rest 15/18 patients (83.4%) we found moderate lung aeration loss. The mean LUSS for each of the lungs left and right were 1.17 and 1.06 respectively, showing absence of statistically significant difference in distribution of the pathological findings between both lungs. The average LUSS by segments in the left upper anterior, upper lateral, upper posterior and left lower anterior, lower lateral and lower posterior segment were: 0; 0.05; 0.22; 2.05; 2.05 and 2.7 respectively, while in the right upper anterior, upper lateral, upper posterior, right lower anterior, lower lateral and lower posterior segment were: 0; 0; 0.16; 1.66; 2.05; 2.5 respectively. According to the results for LUSS by segments we derived an average value for the LUSS of the upper segments versus lower segments which were 0.07 versus 2.1 respectively. We did a statistical analysis of the values for mean LUSS for upper versus lower segments with comparison of two means using www.scistat.com according which difference of 2.03 was calculated with 95% CI from 1.44 to 2.61 and significance level p<0.0001 suggesting existence of statistically significant difference into distribution of pathological findings in between upper versus lower lung segments, suggesting that pathological findings were predominant in the lower areas examined.
VPLUS was calculated for each patient after performing LUS examination. We found that only 4 patients with VPLUS equal of 2, while the other 14 patients were with VPLUS higher than 2. We’ve made a statistical analysis of comparison of two means using www.scistat.com where we’ve compared the mean LUSS of the patients with VPLUS equal of 2 versus the mean LUSS of the patients with VPLUS higher than 2. According to the analysis there was a difference of 3.46 with 95%CI of 0.95 to 5.96 and significance level of p=0.0099, which implies existence of statistically significant higher LUSS values in patients with VPLUS >2 versus patients with VPLUS of 2.
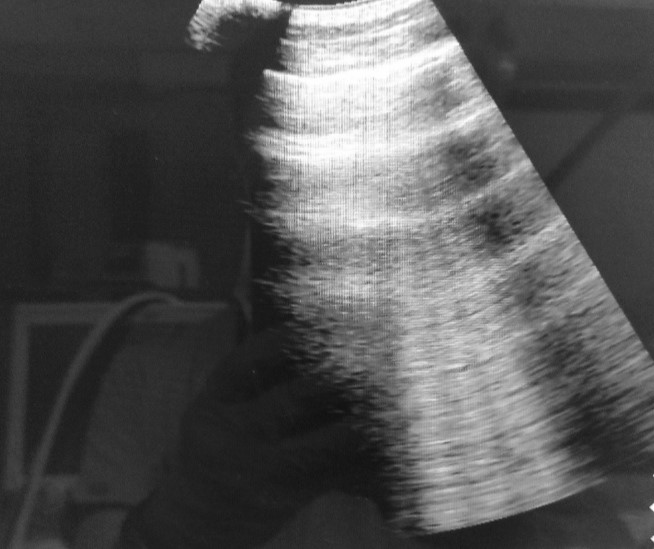
Figure 3. A/B profile: presence of A and B line showing mixed healthy lung parenchyma with parts of the lung with interstitial syndrome.
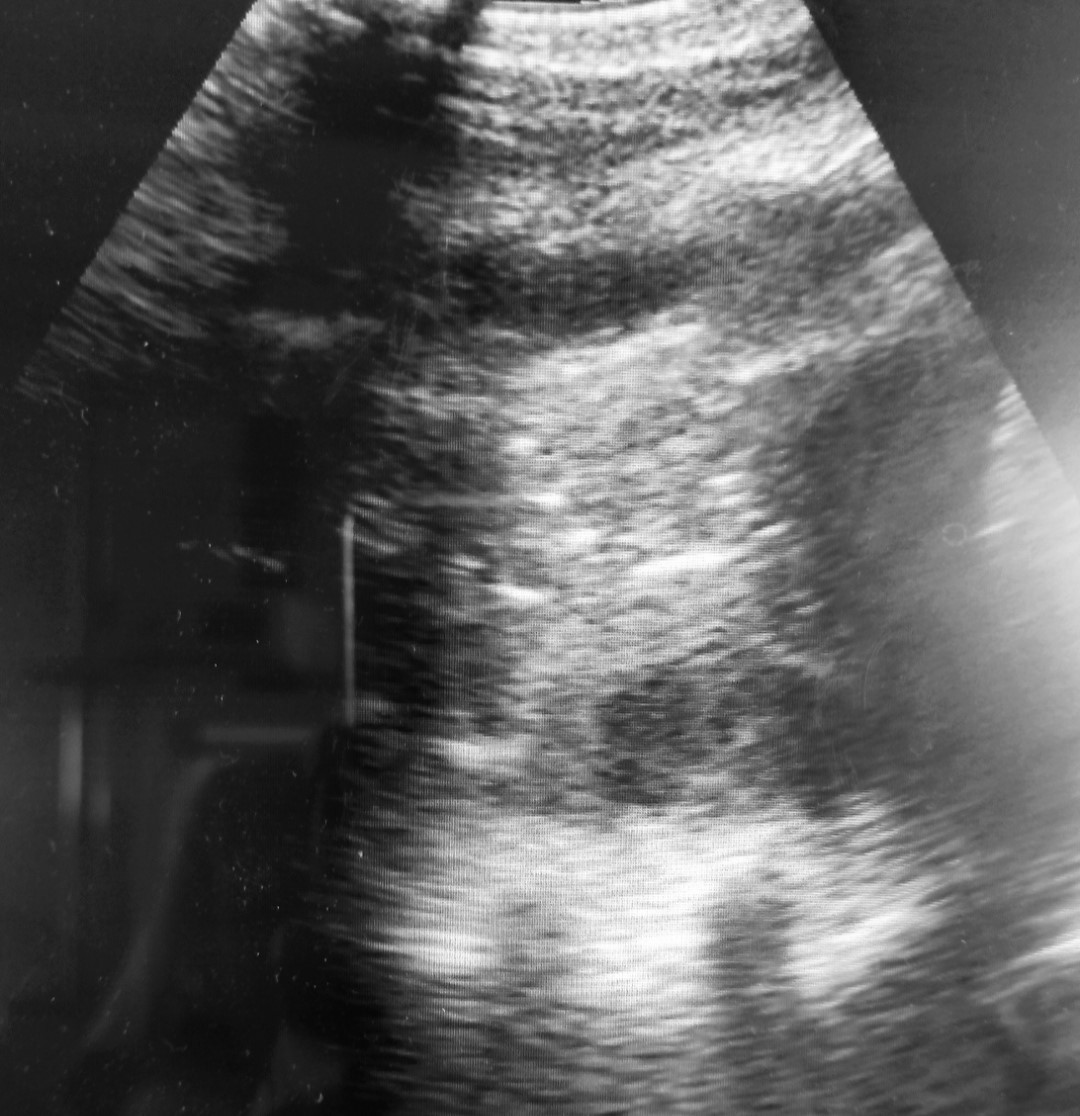
Figure 4. Lung consolidation (tissue like pattern).
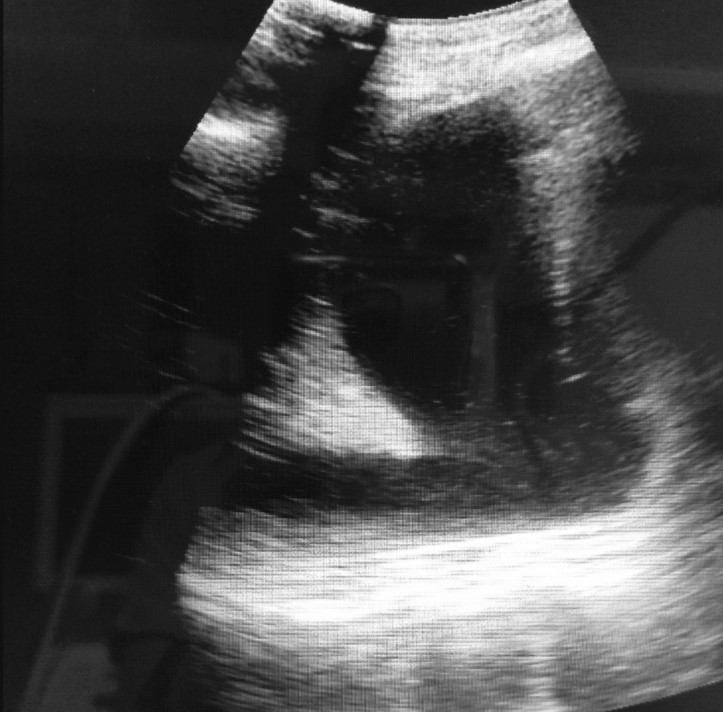
Figure 5. Pleural effusion surrounding the consolidated lung.
Discussion
The risk of developing VAP as nosocomial infection especially rises between 5th and 9th day of the mechanical ventilation, while the probability of VAP occurrence correlates with length of mechanical ventilation (3)(4). According to the microbiological findings in our study the gram-negative bacteria were dominantly isolated in18/18 (100%) patients, as it is well described in the literature (5)(6). The most frequently isolated gram-negative bacteria were Acinetobacter spp. and Pseudomonas aeruginosa, while the most frequently isolated gram-positive bacteria were Staphylococcus aureus which correlates with the statements found in the review made by Papazian L. et al (6).
According to our results derived by LUS, A/B pattern, as well as B pattern were detected at different segments at the same time in all patients examined. In other words, presence of A-lines as a sign of good aeration mixed with 2-3 B-lines as a sign of beginning of alveolo-interstitial syndrome, as well as finding of more than 3, well-shaped, multiple, separated or even coalescent B-lines were found at different areas of examination at the same time in the same patient which could explain the gradual VAP developing with many different pathological findings representing different stages of VAP in development in one patient at a time. In 77% of the patients, we noted presence of lung consolidations while in 61.1% of the patients the detected consolidations were accompanied with presence of air bronchogram suggesting VAP with 93% sensitivity and 81% specificity when both consolidation and air bronchogram were detected (2). Pleural effusions as a parapneumonic events were detected in 38.8% of the patients. Once more, detecting different type of findings in different segments examined in one patient at a time as above mentioned, probably suggests presence of different stages of VAP in development as it is discussed in the studies of Bouhemad B.et al (2) as well as Mongodi S. et al (7). But the presence of subpleural consolidations or lobar consolidations with static or dynamic air bronchograms still are the mainstay of diagnosing VAP by using LUS, especially in patients without previously verified lung damage (8)(9)(10). According to Berlet T. et al the presence of punctiform or linear static either dynamic bronchogram with sensitivity of 100% and specificity of 60% confirms VAP existence (9).
Absence of statistically significant LUSS difference between each of both lungs found in our study, implies that according to distribution of the pathoanatomical changes, VAP is characterized as an infection that affects both lungs simultaneously. But we do find statistically significant difference in the LUSS of the upper segments versus lower examined segments which speaks about obvious difference in distribution of the pathological findings in between compared regions. In other words, pathological findings were predominantly distributed in the lower, posterolateral dependent lung regions, while the upper segments were mostly spared zones at the time of the examination. The statistically significant difference of the LUSS of the upper versus lower segments, did not show only difference in distribution of the LUS findings, but rather difference in their severity also.
We have calculated VPLUS for each patient included in the study, and all of them were fulfilling the criteria for diagnosis of VAP, which according to the literature is VPLUS ≥2 (2)(7). In 4 out of 18 patients we found VPLUS 2, meaning absence of LUS verified consolidation with bronchogram or subpleural consolidation. In the rest of 14 out of 18 patients which were graded as VPLUS 3 or 5, we found presence of subpleural consolidations or lobar consolidation with or without bronchogram. Therefore, we compared the mean LUSS of the group with VPLUS of 2 versus the group of patients where VPLUS >2, and we found existence of statistically significant difference which could imply that patients who have VPLUS of 2 still are not experiencing well defined VAP because of lacking clear presence of consolidations, but those patients rather have Ventilator associated Tracheobronchitis or maybe are in the very early stages when VAP is still in development. According to above discussed finding, we propose re-evaluation of the VPLUS usage as a VAP diagnostic criterion where all patients with VPLUS>2 should be treated as having VAP instead of VPLUS≥2, as mentioned in the literature. On the other hand, the patients with VPLUS 2 should be treated as VA Tracheobronchitis and should be re-evaluated with LUS later.
Conclusion
LUS in daily practice can provide significant data about real time lung events in mechanically ventilated patients, especially those where VAP is suspected. We have concluded that the pathological findings in patients with VAP are distributed in the dependent regions while upper lung segments were spared in both lungs Also, we propose that only patients with VPLUS>2 instead of VPLUS≥2 should be considered as having VAP.
References:
- Lichtenstein DA, Mezière GA. Relevance of lung ultrasound in the diagnosis of acute respiratory failure: the BLUE protocol (published correction appears in Chest. 2013 Aug;144(2):721).Chest. 2008; 134(1):117–125.
- Bouhemad B, Dransart-Rayé O, Mojoli F, Mongodi S. Lung ultrasound for diagnosis and monitoring of ventilator-associated pneumonia. Ann Transl Med 2018; 6(21):418.
- Cook D, Walter S, Cook R, Grifth L, Guyatt G, Leasa D, Jaeschke R, Brun -BC (1998) Incidence of and risk factors for ventilator-associated pneu‑ monia in critically ill patients. Ann Intern Med 129:433–440 10.
- Forel JM, Voillet F, Pulina D, Gacouin A, Perrin G, Barrau K, Jaber S, Arnal JM, Fathallah M, Auquier P, Roch A, Azoulay E, Papazian L (2012) Ventilator-associated pneumonia and ICU mortality in severe ARDS patients ventilated according to a lung-protective strategy. Crit Care 16:R65.
- Di Pasquale M, Ferrer M, Esperatti M, Crisafulli E, Giunta V, Li Bassi G, Rinaudo M, Blasi F, Niederman M, Torres A (2014) Assessment of severity of ICU-acquired pneumonia and association with etiology. Crit Care Med 42:303–312.
- Papazian L, Klompas M, Luyt CE. Ventilator-associated pneumonia in adults: a narrative review.Intensive Care Med. 2020; 46(5):888-906. doi:10.1007/s00134-020-05980-0.
- Mongodi S, Via G, Girard M, et al. Lung Ultrasound for Early Diagnosis of Ventilator-Associated Pneumonia.Chest. 2016;149(4):969-980. doi:10.1016/j.chest.2015.12.012.
- Staub, L. J., Biscaro, R. R. M., & Maurici, R. (2019). Emergence of Alveolar Consolidations in Serial Lung Ultrasound and Diagnosis of Ventilator-Associated Pneumonia.Journal of Intensive Care Medicine. doi.org/10.1177/0885066619894279.
- Berlet T, Etter R, Fehr T, Berger D, Sendi P, Merz TM. Sonographic patterns of lung consolidation in mechanically ventilated patients with and without ventilator-associated pneumonia: a prospective cohort study.J Crit Care. 2015; 30(2):327-333. doi:10.1016/j.jcrc.2014.11.021.
- Staub, L. J., Biscaro, R. R. M., & Maurici, R. (2018). Accuracy and Applications of Lung Ultrasound to Diagnose Ventilator-Associated Pneumonia: A Systematic Review.Journal of Intensive Care Medicine,33(8), 447–455. doi:10.1177/0885066617737756.